Your Lab Reference Range Changed Between Tests. Here Is Why.
Quick Answer: Reference ranges are set by each individual lab based on its own equipment, methods, and the local population it sampled - they are not national standards. The same ferritin value can be flagged low at one lab and normal at another. When comparing results across labs, compare the raw value and the range together, never the flag alone, and ask whether the assay method changed.
This catches people out constantly, particularly after switching clinics or insurers. Nothing about your body changed. The measuring stick did.

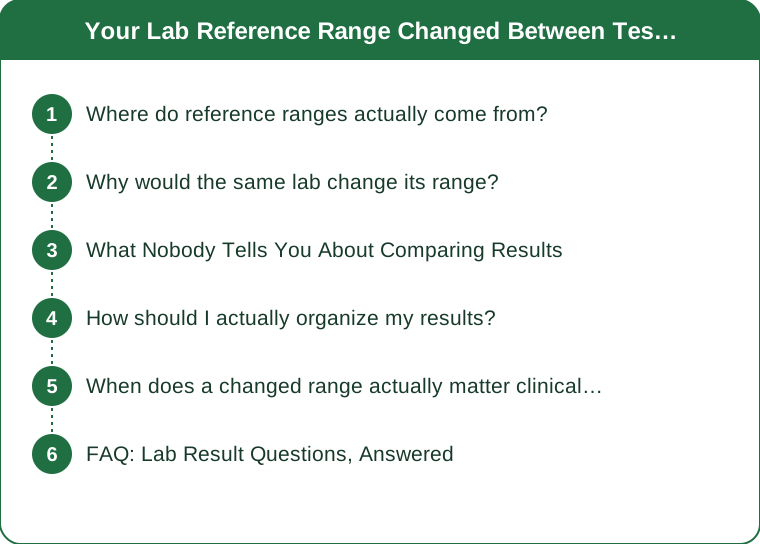
Where do reference ranges actually come from?
Each laboratory establishes its own, and the standard method is statistical rather than clinical.
A lab measures the analyte in a group of people considered healthy - often 120 or more individuals - and then defines the reference interval as the central 95 percent of those results. The lowest 2.5 percent and highest 2.5 percent fall outside it by definition.
Two consequences follow, and both are underappreciated.
First, roughly 1 in 20 healthy people will fall outside the range on any given test, purely by construction. Run a 15-test panel and there is a good chance at least one value gets flagged even if everything is fine.
Second, the range reflects the population the lab sampled - its age distribution, its geography, its typical patient mix. A lab whose reference group skews older will have a different range than one whose group skews younger.
Why would the same lab change its range?
Usually one of three reasons, and the report often says which.
New analyzer or reagent lot. Different instruments measure the same molecule slightly differently. When a lab replaces equipment, it revalidates its ranges, and they can shift by a few percent or more.
Assay method change. This is the big one. Vitamin D, thyroid antibodies, and testosterone in particular have multiple measurement methods that are not directly interchangeable. Switching from one to another can move both the value and the range meaningfully.
Updated clinical guidance. Occasionally a professional body revises what counts as normal and labs follow. The A1c and lipid thresholds have both moved over the past two decades.
If a range changed on your report, it is worth asking the ordering clinician whether the method changed. That single question resolves most of the confusion.
What Nobody Tells You About Comparing Results
Three things that make year-over-year comparison harder than it looks.
Biological variation is bigger than people expect. Many analytes swing 10 to 20 percent within the same person across days, independent of health. Ferritin, iron, and white cell counts are particularly variable. A change of that size between two tests may be noise rather than a trend.
Time of day matters for several common tests. Cortisol, iron, and testosterone all have pronounced daily rhythms. A morning draw and an afternoon draw are not comparable for those, even at the same lab.
Fasting status changes more than glucose. Triglycerides in particular move substantially with recent eating, which is why a non-fasting lipid panel and a fasting one are not directly comparable.
The practical version: for a real trend, you want three or more results from the same lab, drawn at a similar time of day, under similar conditions. Two results from two labs is rarely enough to conclude anything.

How should I actually organize my results?
A simple spreadsheet beats a folder of PDFs, and it takes about 20 minutes to set up once.
For each test, record five columns: date, value, the lab’s reference range for that report, the lab name, and any conditions - fasting, time of day, medications, whether you were ill.
That fifth column is the one people skip and the one that explains most anomalies later.
Then when you look at a trend, you are looking at values against their own ranges rather than at flags. A ferritin of 32 with a range of 15 to 150 and a ferritin of 32 with a range of 30 to 400 tell very different stories, and the flag alone would have told you almost nothing.
Bring the spreadsheet to appointments. Most clinicians only see the results their own system holds, and a patient who arrives with three years of organized values from two labs is giving them information they genuinely did not have.
When does a changed range actually matter clinically?
When it moves your value across a decision threshold rather than a statistical boundary.
Some thresholds are genuinely clinical - meaning treatment decisions hang on them - and those are far more standardized across labs. A1c at 5.7 and 6.5 percent, LDL targets, and TSH treatment thresholds are set by guidelines, not by local population sampling.
Other values are purely statistical ranges with no treatment threshold attached, and being slightly outside one is usually a prompt to repeat the test rather than to act.
The question worth asking your clinician is direct: is this number outside a statistical range, or outside a treatment threshold? Those are different situations and the answer changes what happens next.
Also worth asking: should this be repeated, and if so, when and under what conditions. Many borderline values resolve on a repeat draw, and knowing that in advance saves a lot of worry. This is general information, not medical advice.
FAQ: Lab Result Questions, Answered
Should I always use the same lab?
Where you can, yes. It removes the largest source of noise in year-over-year comparison. If your clinic changes labs, note the date so you know where the discontinuity is.
Is a flagged result something to worry about?
One mildly flagged value on a large panel is statistically expected in healthy people. A value flagged repeatedly, or one that is well outside the range, is the kind worth discussing. This is general information, not medical advice.
Why is my result normal but my doctor still wants a recheck?
Often because of trend rather than position. A value moving steadily in one direction within the normal range can be more informative than a single flagged number.
TL;DR:
- Reference ranges are set by each lab from its own equipment and local sample, not by a national standard.
- They are defined as the central 95 percent of a healthy group, so about 1 in 20 healthy results falls outside by design.
- Ranges change when analyzers, reagents, or assay methods change - ask whether the method changed.
- Compare the value and the range together, never the flag alone.
- Track date, value, range, lab, and conditions in one spreadsheet. Conditions is the column that explains anomalies.
- Ask whether a number is outside a statistical range or a treatment threshold. They mean different things.
A number that got flagged this year and did not last year is a reason to ask one specific question, not a reason to lose a weekend to searching. This is general information, not medical advice.
Keep Reading
This article is for general informational purposes only and is not medical advice. Always consult a qualified health professional for guidance specific to you.